Four structural price levels have capped SPY at every major cycle high since 1999, each absorbing major corrections before eventually giving way. A backtest across SPY's full history identified two signals that historically separate bear market tops from breakouts at these levels. One is already readable. The other becomes available only after the high is set.
The 2022 all-time high came in at $477.71. The level was $477.58. The gap was $0.13.
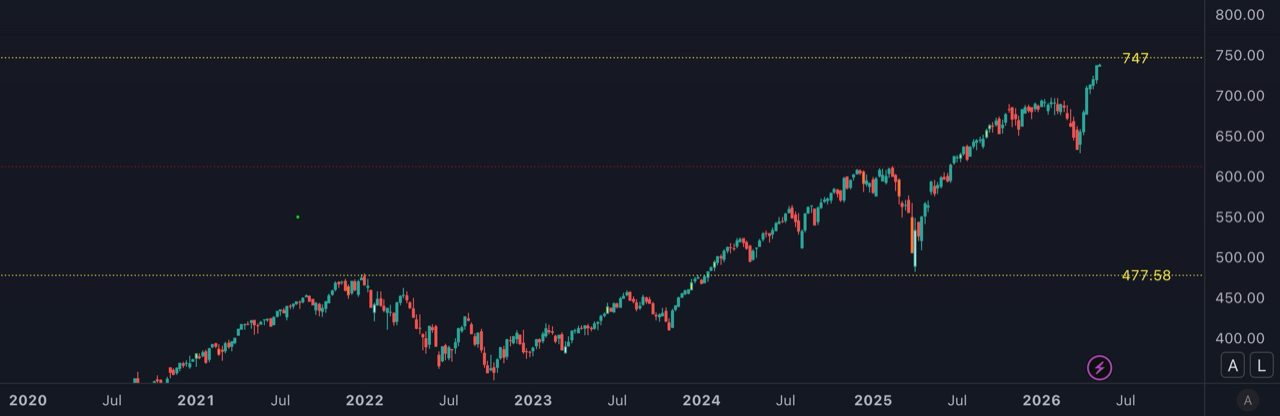
SPY closed Friday at $737.62. The next level is $747.00.
What these structural price levels are
A fixed mathematical formula applied to SPY's earliest price data generates a series of structural price levels across its full history. The formula has not been modified since it was first run. A trader using it in 1999, before the dot-com peak, would have produced the same output.
Four of those levels have acted as major ceilings over the last 25 years. The backtest covers every trading day from SPY's launch in January 1993 through the end of 2025: 8,288 days. Each of those four levels has been reached, tested, and eventually left behind.
What the record shows at each level
The pattern at every level has been the same. Price approaches from below, enters a zone of friction (the region within 7% of the level), and stalls. What follows is never clean: corrections, recoveries, failed attempts to push through, and eventually one of two outcomes.
The first resolution is a major correction or bear market, with SPY peaking near the level and falling sharply. The second is a breakout: after enough failed attempts, the level gives way permanently and price never returns.
Both have happened at every level.
| Level | Active Era | Major tops at this level | Largest correction | Breakout / Status |
|---|---|---|---|---|
| Level 1 | 1999 – 2013 | 2000 (dot-com), 2007 (GFC) | -56.5% (2007 – 2009) | 2013, never returned |
| Level 2 | 2014 – 2016 | 2015 (flash crash) | -14.3% | December 2016, never returned |
| Level 3 | 2018 – 2020 | 2020 (pre-COVID top) | -35.6% in 33 days | August 2020, never returned |
| $477.58 | 2022 – 2024 | 2022 bear market start 2024 breakout level |
-27% over 9 months | Confirmed support, April 2025 |
The 2022 ATH came in at $477.71. The level was $477.58. The gap was $0.13, smaller than the daily trading spread on most retail platforms. The price found them anyway.
The breakout is not a failure of the indicator. Every level that eventually gave way had first contained price for months or years and produced at least one double-digit correction. Giving way is the completion of the cycle, not the exception to it.
Every previous level eventually broke higher. What history does not record is how long. The first level held for fourteen years and two bear markets. The second held for two years. The clock at $747 is now running.
Two signals that separate bear markets from breakouts
A backtest across every approach to these structural levels in SPY's full history produced two findings with statistical support.
The first is the speed of approach. SPY enters a friction zone, defined as the region within 7% of the level, before eventually reaching the level itself. The time between entering that zone and reaching the peak price is a strong predictor of the decline that follows.
Approaches that peaked within 252 trading days (roughly one calendar year) of entering the zone had an average subsequent peak-to-trough decline of -37.9%. Eight of those nine cases produced a decline of 25% or more. Approaches that took longer than 252 trading days to peak had an average decline of -11.7%. Only 4 of the 15 slow approaches produced a decline above 20%.
The separation holds consistently across all 24 approaches in the dataset. A fast approach has less support built below it. When the level holds as resistance, the falls have historically been steeper.
The second signal is post-peak volume. In the 20 trading sessions after the high, all four confirmed major tops produced trading volume at least 1.46 times the trailing 12-month average. All four clean breakouts stayed below 1.24 times. There is no overlap in the dataset. The gap between 1.24 and 1.46 is the threshold range. Volume in that zone, in the weeks after the eventual high, is a confirming signal that price is being distributed rather than accumulated.
Neither finding is based on a large sample. Four observations per group in the volume test, nine in the fast-approach category. Both are derived from price and volume data only: no macro variable, no earnings revision, no central bank announcement. The signals are in the tape.
Where the current setup stands
SPY entered the friction zone below $747 in approximately October 2025. The close on May 8, 2026 was $737.62, roughly 150 trading days into the zone. The level has not been touched yet.
By the speed criterion, 150 trading days places this in the fast category, well under the 252-day threshold. The 2022 setup peaked at 99 days. But the shape of the current approach is different. The monthly chart shows five months of consolidation inside the zone before the current push toward $747. That is not a straight-line momentum run. Some base was built before the latest push. The clock says fast. The structure is more measured than 2022.
This is the first time SPY has approached $747. There is no prior history at this level to draw on. The prior levels do show one consistent pattern: every first approach produced at least one correction of 14% or more before the level was eventually cleared. The April 2025 tariff crash already tested the prior level: SPY's intraday low on April 7, 2025 was $481.80, less than 1% above $477.58, before recovering +19% over the following 20 trading sessions. The prior level is now confirmed support.
The monthly chart adds a behavioral layer. In the five months before the current push, SPY formed a flat consolidation below the level, a pattern that reads as a top to anyone unaware of what lies above. The sixth candle reversed sharply. Participants who sold the false ceiling are now watching price move away from them.
This sequence (false ceiling below the structural price, then violent push toward it) has appeared at prior levels in the weeks leading up to first contact. It resolves only on contact. Once $747 is touched, the real decision begins: the volume signal in the following 20 sessions will distinguish a genuine top from a level being cleared. Until then, the market is still in the approach.
The limits of the analysis
The backtest covers every trading day SPY has existed. As levels become more widely spaced, fewer tests occur at each one. That is precisely what makes the $0.13 precision at $477.58 meaningful: few tests, each landing close. In the volume test, there are 4 observations per group. The 1.24–1.46× threshold is an observed gap in the data, not a calibrated cutoff. The finding is consistent. It does not support a precise forward probability.
Every finding in the backtest is based on SPY's behavior at levels it had approached before. The first level had a 14-year track record. The $477.58 level had four years and three separate approach cycles before the 2022 top. The $747.00 level is being approached for the first time. The prior levels support the framework. They do not guarantee it applies at $747.
When SPY approaches a structural level quickly and then corrects, the declines have historically been much deeper than when it arrived slowly. The current approach is fast. If $747 holds as resistance and SPY turns lower from here, fast-approach history puts this in the category where corrections have averaged -37.9%. If $747 breaks and SPY closes above it on strong volume, approach speed is no longer relevant. The framework says nothing about how far price goes once a level is cleared.
How to read this moment
This framework does not produce a buy signal or a sell signal. What it produces is a zone where the same question has been asked at every level: does this give way, or is this the top of the cycle?
One signal is already set: the approach is fast. The second becomes readable only after SPY peaks or clears $747. Post-peak volume in the 20 sessions that follow will determine which scenario applies.
| Scenario | Observable signal | Historical parallel |
|---|---|---|
| Distribution | SPY peaks in the $747–$820 range; post-peak volume above 1.4x the 12-month average within 20 sessions | Consistent with 2000, 2007, Feb. 2020, and 2022 tops. Fast-approach mean decline: -37.9% (9 cases). |
| Consolidation | SPY peaks, volume stays below 1.25x; approach time extends past 252 trading days from zone entry | Shifts toward slow-approach pattern. Slow-approach mean decline: -11.7% (15 cases). |
| Breakout | SPY closes above $747 on expanding volume; no post-peak volume spike; holds above level for 10+ sessions | Consistent with 2013, 2016, and Aug. 2020 breakouts. Prior level ($477.58) becomes confirmed support; trend continues. |
The friction zone is not a verdict. It is the point where the market stops being passive about its direction. At every prior level, price spent weeks to years in this zone before one outcome or the other became clear. The zone is active now. The resolution is ahead.
One parallel worth noting
SPY is not the only major index at a structural level right now. The Hang Seng is simultaneously retesting the underside of its 35-year rising trendline.
Nineteen years of rolling data show HSI and SPY are weakly correlated, with an annual average of 0.22. Over the past two months SPY has rallied to within 1.3% of $747, without having touched it yet. HSI has consolidated over the same period. The two markets are not moving in tandem.
That low correlation has one known exception: acute global risk-off. In March 2020 it hit 0.60. If a reversal pattern develops at $747, whether HSI follows will depend on what drives it.
Past SPY declines driven by US-specific factors did not pull Hong Kong down. Global events did.
The data does lean toward one scenario. A fast approach to a structural level has preceded a sharp correction eight times out of nine in this backtest. That is the setup here. The volume signal in the 20 sessions after the high will confirm whether it plays out.
For anyone already positioned, the distinction has practical shape: if any correction at this level stays US-specific, the historical pattern suggests Chinese equities would not be dragged down in kind. Whether relative haven or a different risk altogether, it is worth knowing before the level is touched.
I will publish a follow-up once $747 is first touched and the post-peak volume data becomes readable.