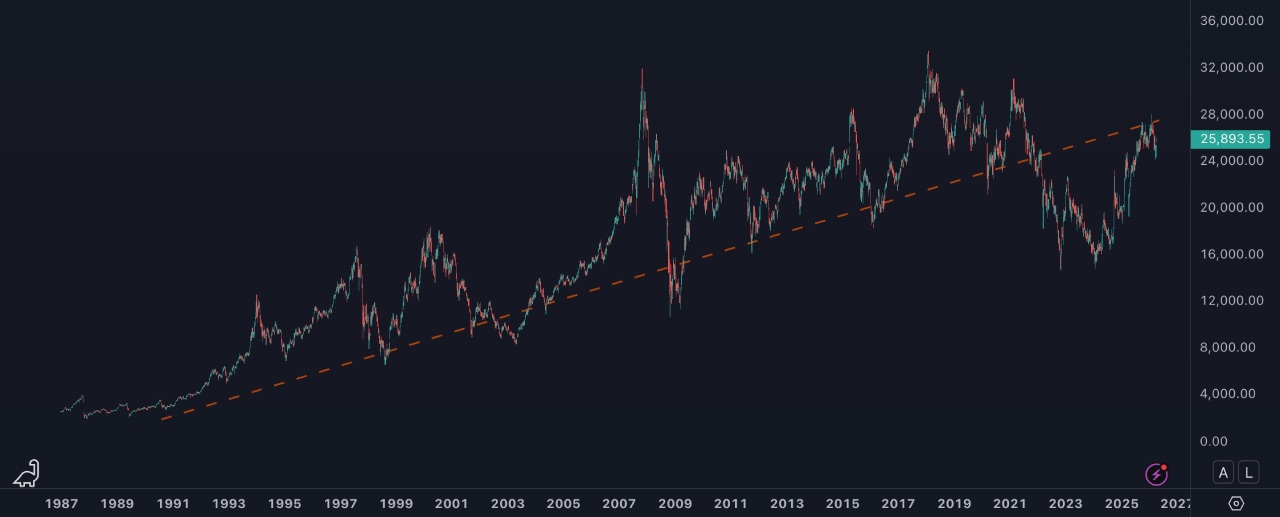
In October 2022, the Hang Seng broke its 35-year trendline for the first time, collapsing to 14 604. It has since recovered +77% to 25 893, pushing back against the underside of that same line. The break was caused by identifiable, temporary disruptions. They have reversed. The recovery is real. The question now is how far it goes.
Draw a line from the Hang Seng's floor in 1987 through every major crisis bottom: 1998, 2003, 2009, 2016. The line rises at a consistent angle across four decades. It held for 35 years. Then, in October 2022, the index broke below it for the first time, collapsing to 14 604.
That break was the anomaly. What has happened since is the recovery: +77% in 18 months, with the HSI now back at 25 893, pushing against the underside of that same trendline. The question is not whether the line will break. It already did. The question is whether the price reclaims it.
The evidence says it will.
What the line represents
The trendline is the floor of Hong Kong's secular growth rate: the minimum pace at which the exchange has compounded since the modern era began. Five times in 35 years the market touched it from above: 1998, 2003, 2009, 2016. Five times it held. The 2022 break was the first time in the index's history that the floor gave way.
That matters because it tells you what the 2022 collapse was not: it was not a normal correction within a secular uptrend. It was a genuine structural rupture, driven by a dateable sequence of policy decisions, a property default, and a two-year capital exodus. The line broke because something specific happened. And specific causes have specific endings.
Why the break was an anomaly, not a verdict
Three specific events caused the 2022 collapse, and all three have since reversed or stabilised.
Beijing's regulatory crackdown on technology companies peaked in 2021 and has been unwinding since. The PBOC's coordinated stimulus package of September 2024 (reserve requirements cut 50 basis points, RMB 800 billion earmarked for equity stabilisation) was the clearest signal that the policy direction had reversed. The Evergrande default cascaded through the property sector, but the contagion was contained. Jardine Matheson, CK Hutchison, and Hongkong Land had no meaningful exposure to Chinese residential development. They were sold anyway, indiscriminately. Zero-COVID ended. Foreign institutional flows turned positive in October 2024 for the first time since February 2022.
The bear case does not explain why a company that earns only 12% of its revenues from Greater China trades at one third of book. CK Hutchison's ports are in Rotterdam, Panama, and Colombo. The China discount was applied to a business that is structurally global. That is not a verdict on Hong Kong. That is a category error. Category errors correct.
The Line Should Reject. The Economy Below It Has Grown 80%.
The default in technical analysis is unambiguous. Broken support becomes resistance. When a trendline is retested from below (as the HSI's 35-year floor is being retested right now at 25 893) the odds historically favour rejection. The price touches the underside and falls. That is what the pattern predicts. That is the bear case made visible on a chart.
But a trendline is only as valid as the economy it represents. And the economy underneath this one has not been static. In 2014, China's GDP was $10.4 trillion. In 2024, it was $18.7 trillion, an 80% expansion in ten years. This is not a market recovering to where it was. It is an economy that has permanently repriced its weight in the global order.
In 2024, China filed 1.8 million patents, nearly half the global total, for the fifth consecutive year. The United States filed 501 000. The gap is not closing. It is widening. What is being built is not export-dependent assembly. It is a technology base that generates structural leverage: $49 billion committed to domestic AI semiconductors through the third iteration of its National IC Fund, with a stated target of 80% chip self-sufficiency by 2030.
The Belt and Road Initiative deployed $121.8 billion in 2024 alone (a 31% increase on the prior year) across 149 countries. Of that, $21.4 billion went into metals and mining, a record, concentrated in the critical minerals that underpin battery production, solar manufacturing, and semiconductors. China is not borrowing the raw material supply chains it needs. It is locking them in at scale, one infrastructure agreement at a time.
The argument is not that Hong Kong is China. The argument is simpler. A trendline represents the floor of a market anchored to an economy. When that economy has grown 80% in a decade, filed half the world's patents, and secured raw material access across 149 countries, the floor is not fragile. The usual rule says broken support becomes resistance: a line that breaks turns into a ceiling overhead. But that rule assumes nothing underneath has changed. Here the economy beneath the line has grown faster than the price above it. That is the case being made here.
The price has recovered. The underlying NAV discounts have not moved at the same speed. After a +77% recovery in the index, the major conglomerates are still publishing discounts that have no precedent in developed markets.
| Company | Documented NAV Discount | Source |
|---|---|---|
| Great Eagle Holdings | −87.5% | 2025 Annual Results Presentation (March 2025) |
| Hongkong Land | −75% | FY2025 Preliminary Results (February 2026) |
| CK Hutchison | ~−50% post-ports deal | FY2025 balance sheet, Bloomberg estimates |
| Jardine Matheson | −27% | FY2025 Analyst Presentation |
These are not distressed valuations from October 2022. These are the numbers as of early 2026, after the full recovery. A market at equilibrium does not produce an 87.5% NAV discount on a company that owns hotels in New York, London, and Hong Kong and a Central commercial portfolio in one of the world's most liquid real estate markets. The price has moved. The confidence has not followed.
The risks that do not go away
The trendline has survived five crises over 35 years. It has never been tested against a direct military confrontation in the region. A Taiwan scenario would reprice every Hong Kong valuation regardless of NAV, trendline, or corporate action. That risk has receded from the front page. It has not disappeared from the balance sheet.
If the property cycle, demographics, and debt dynamics create a 20-year ceiling similar to Japan's lost decades, then the trendline is not support. It is the last line before the index reprices permanently lower. The 35-year trendline is informative precisely because it has never broken. Its first failure would be the signal, not a noise event to buy through.
How to read this moment
The HSI at 25 893 is pushing against the underside of the 35-year trendline. Reclaiming it would confirm that the 2022 break was a temporary dislocation, not a structural shift. The broad recovery trade is largely done. What remains is company-specific: the names where a privatisation offer, a share buyback, or an asset disposal compresses a documented NAV discount within a defined window. The trendline reclaim is the macro backdrop. The catalyst is the individual thesis.
| Scenario | Observable Signal | Implication for HSI |
|---|---|---|
| Recovery | Price closes above trendline; southbound flows sustain; corporate disposals accelerate | 28 000–32 000 within 18 months |
| Consolidation | Price holds 24 000–27 000; trendline tested repeatedly; no escalation | Index flat, stock-picking generates alpha |
| Rejection | Taiwan risk repriced; mainland flows reverse; index closes below 22 000 on volume | Retest of 18 000–20 000 |
The line broke once in 35 years, for identifiable reasons that have since reversed. The recovery has already started. At 25 893, the market is asking whether the trendline reclaims as support, not whether the recovery exists. It does.